
 •
• 
When evaluating a web security solution, there are multiple aspects to consider. Among them are:
This post will be about Curiefense’s performance: we’ll show the results from recent testing, describe how these statistics were generated, and discuss how you can run the same tests within your own environment if desired.
When a web security solution is used to filter incoming traffic, it can introduce three types of latency:
By running inside the environment, Curiefense avoids the first two types of latency. (This already gives it an advantage over most commercial security solutions, which run outside the origin’s environment and introduce all three types.)
Of course, Curiefense still requires a non-zero length of time to filter traffic. We periodically measure this for a variety of loads; here’s how we do this.
To measure Curiefense’s processing latency, we:
To run these tests in your own environment, you can use this deployment script in the GitHub repo, which will deploy Curiefense into GKE, along with the instrumentation necessary for the test. You will also need the scripts in the repo’s latency folder.
When we measure Curiefense’s performance, we test different combinations of:
…and then graphing them according to Percentile, where:
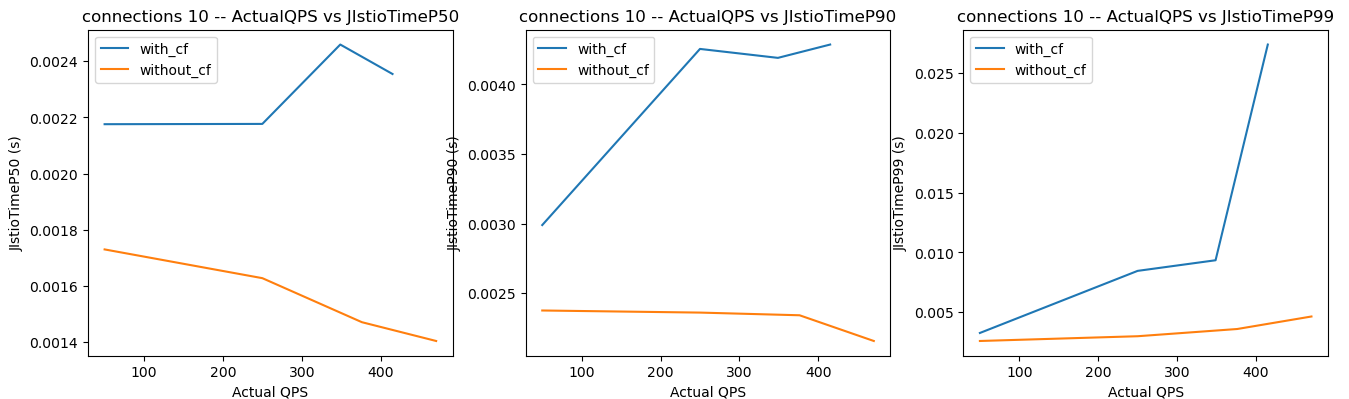
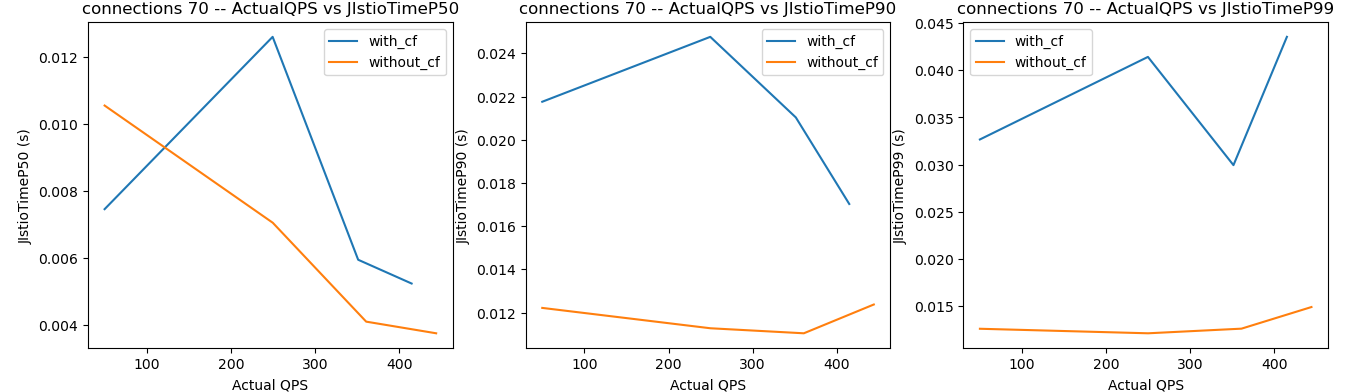
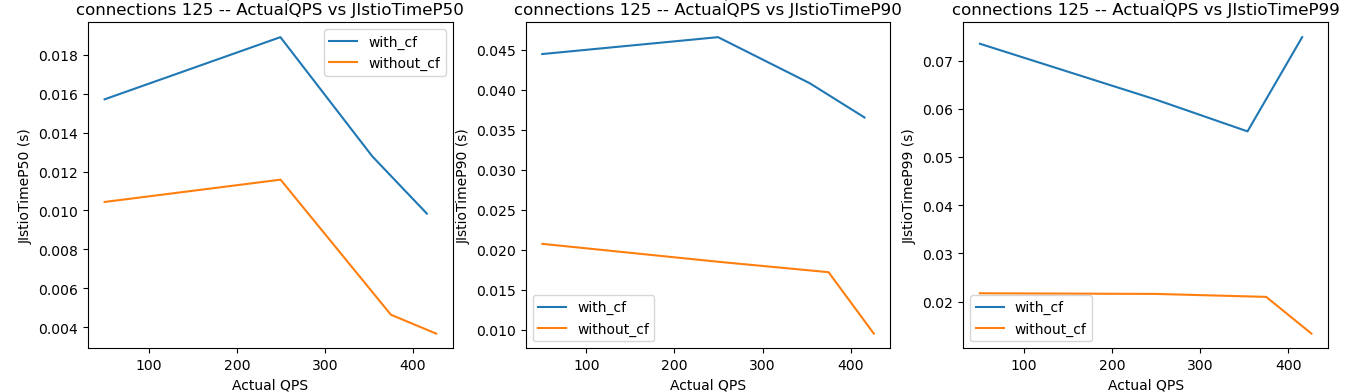
Here are the results from a recent test, where the orange lines are the processing times for requests without Curiefense (i.e., the infrastructure’s processing time), and the blue lines are the processing times with Curiefense.
Note the relevant metric is not each blue line’s absolute value, as shown on the left axis. Instead, Curiefense’s processing time for a given QPS is the difference between the values shown on the orange line and blue line.
For 10 open connections, processing times at low loads are a few milliseconds, approaching 25 ms at high loads.
For 70 connections, times are similar, up to about 30 ms at high loads.
At 125 open connections, processing times for some queries are still low, while at high loads, some approach 50-65 ms.
At 250 open connections, we see processing times range from ~20 ms up to a worst case of about 120 ms at high loads.
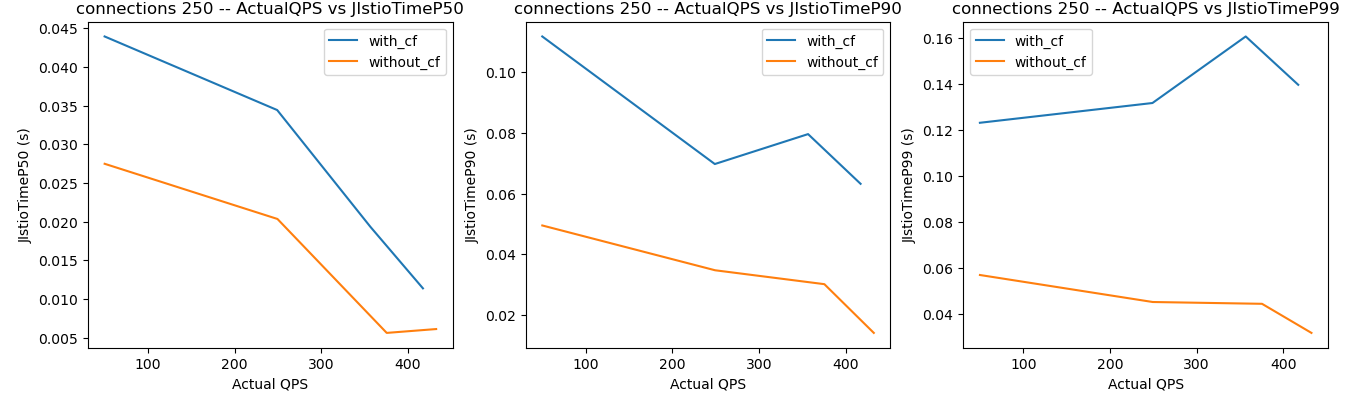
Note however that at the 50th percentile, the latencies are still small (less than 20 ms). In other words, even at high loads and with a large number of open connections, half or more of the incoming requests are processed very quickly, while even the worst cases still have good performance.
Curiefense is a highly performant security platform. Its architecture eliminates two major sources of added latency that are inherent to most web security solutions. As for processing latency, it is modest for most requests in most use cases.
Hopefully this brief discussion has been helpful. We run these tests periodically as part of our larger effort to keep improving Curiefense, and make it the best cloud native web security platform possible.
